
If you haven’t read part 1 of this miniseries, go take a look. To really briefly summarise, it tells a short backstory about why the PDAL + Entwine needs to be on the radar for anyone considering massive point-cloud based data management; and provides a couple of terrestrial examples.
Here, we tackle hydrography. The GEBCO Seabed 2030 is going to collect epic amounts of data about the seafloor, it’s topography and composition. It’s going to be multi-resolution, collected by many ships, and require many disparate methods of data QA/QC. It will also no doubt generate a new wave of web portals aimed at making datasets easy to access; and many derivative products occupying space on hard drives in multiple places.
…but it doesn’t have to.
I’ll use the Geoscience Australia MH370 phase 1 dataset to show some reasons why.
The entire dataset was stripped from a THREDDS server as ASCII files using the Siphon library and a Jupyter notebook. From there, PDAL was used to reproject from EPSG:4326 to EPSG:3577 (Australian Albers Equal Area), invert Z so that depth is a negative number, colourise to show a depth scale from 0 to -8100, and add a ship code added to the PointSourceID field (so you can use the ‘source’ menu to view points by collection platform). Finally, it was converted (losslessly) to an Entwine octree which you can see here (or in a full window here):
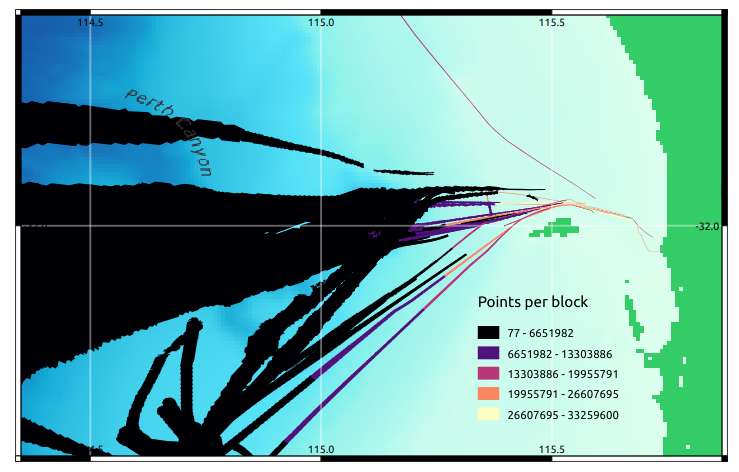
Interestingly, more than half the data occupy the transit region just west of Perth, shown in this visualisation of data chunks by point number – which made calculation of resources to generate the octree a little tricky:
That aside, what can we do with it now?
Using the same dataset (yes, the exact same bytes on disk), let’s make a 5m contour map of a slope into Diamantina deep, one of the deepest points in the Indian Ocean, off Western Australia. We need a pipeline to create the first stage – creating a DSM. We choose 20m resolution, to try and capture more than one point per grid cell; and create a 5 x 5 kilometre block:
{
"pipeline": [
    {
        "type": "readers.ept",
        "filename": "http://act-2015-rgb.s3.amazonaws.com/",
        "bounds": “([-2639580, -2635580], [-4137200,-4142200])"
    },
    {
        "type":"writers.gdal",
        "gdalopts":"t_srs=EPSG:3577",
        “resolution":20,
        “filename”:"diamantina-dsm.tiff",
        "output_type":"idw"
    }
 ]
}
…saved as diamantina-dsm.json and run using:
pdal pipeline diamantina-dsm.json
Next, open the DSM in QGIS and create some contours (or use gdalcontour on the command line), and we can make a pretty map like this:

…which we can visualise in 3D as a surface (thanks QGIS!):

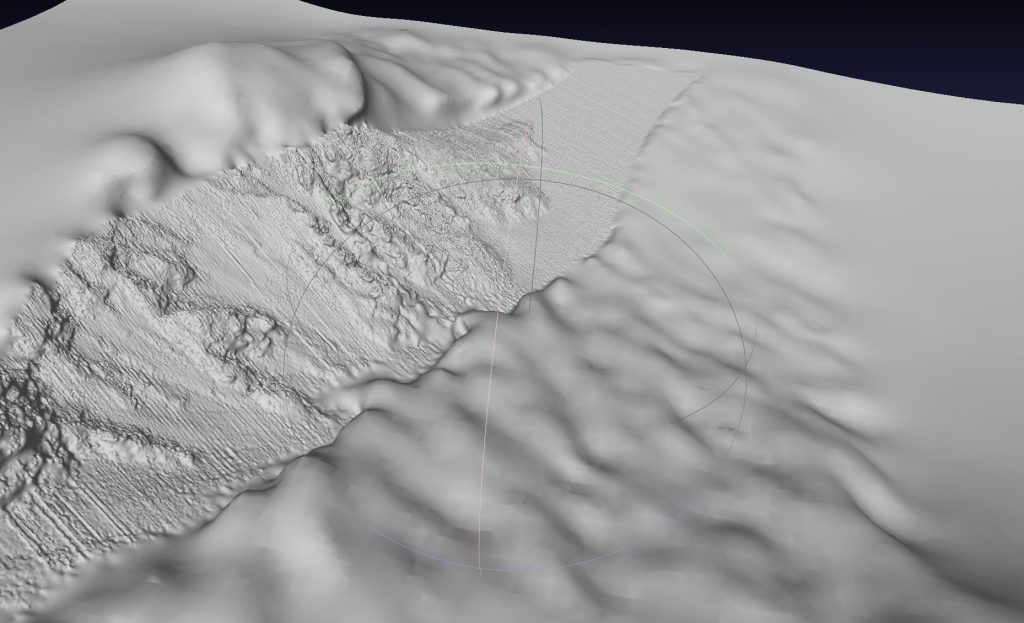
…or we could create a mesh model:
{
pipeline [
    {
        "type": "readers.ept",
        "filename": "http://act-2015-rgb.s3.amazonaws.com/",
        "bounds": "([692738, 692967], [6092255,6092562])"
    },
    {
        "type":"filters.poisson",
        "depth": 32
    },
    {
      "type": "writers.ply",
      "filename": “diamantina-mesh.ply",
      "faces": true
    }
]
}
…and check it out in meshlab:

Moar!
Because we love moar!, what’s next? How can we extend this?
MH370 Phase 2.
The MH370 phase 2 dataset is a mixture of ship, deep towed vehicle, and AUV collections – is much denser, contains more data, and has much greater resolution. Here’s one dataset – a deep tow dataset from the ship Go Phoenix, merged with AUV data collected from MV Fugro Equator (see in a full window here)
Phase 2 data processing was hard – while the data are open, they’re poorly structured and almost metadata free. I understand the politics and pressures on organisations to publish data – so I don’t want to be overly critical of this incredible resource. However – it’s not a straightforward task to unpack it.
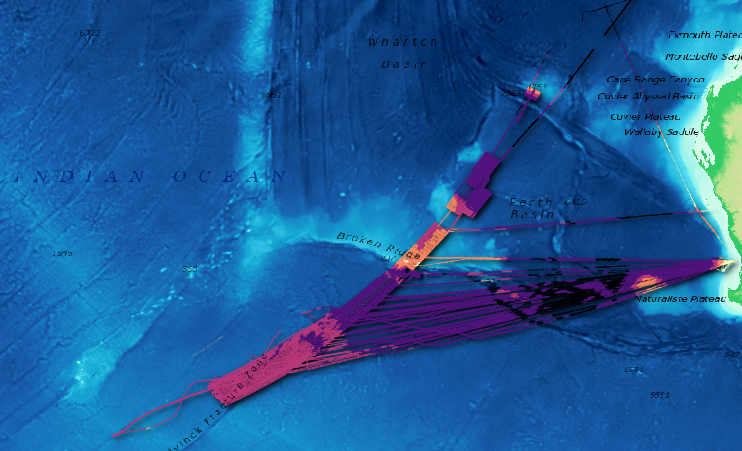
On the positive note – I did learn a lot about PostGIS and jq. Necessity is the mother of invention – I needed a quick way to inspect spatial reference translations (guessing the source CRS for each dataset was fun!); and cull data well outside the survey region. Here’s a cool map I made from the process – and I now have a PostGIS database containing a spatial index of every survey ‘block’ in the MH370 program:
Exploring the point cloud visualisation, you can view data by ‘source’ to see which data were collected by the AUV; and which were collected via deep tow.
Inspecting closely, you can see that the two surveys don’t line up incredibly well – buuut, I would hesitate to call that a fail. Swath matching has consumed decades of research above-ground, where navigation technology is incredibly good. Underwater? less so. In my books, it’s a great start – and some deeper data wrangling has likely been done on downstream products. Recall also that these are ‘raw’ data – as raw as I could find in the data warehouse without going to echosounder output files.
Segue over, let’s include some phase 2 data in a model, and show a PDAL capability I haven’t demonstrated yet – multiple readers. We don’t need to create a gimassive index for all the world – we can keep sane separation of data in logical collection units; and combine the parts we want. Here, we’ll push out a mesh:
{
"pipeline": [
    {
        "type": "readers.ept",
        "filename": "http://mh370-phase1.s3.amazonaws.com/",
        "bounds": "([-3453000, -3452000], [-4324000, -4322000])",
        "tag": "phase1"
    },
    {
        "type": "readers.ept",
        "filename": "http://mh370-phase2-equatorauv-gophoenix.s3.amazonaws.com/",
        "bounds": "([-3453000, -3452000], [-4324000, -4322000])",
        "tag": "phase2"
    },
    {
        "type":"filters.merge",
        "tag":"merged",
        "inputs":[
                "phase1",
                "phase2"
            ]
    },
    {
        "type":"filters.poisson",
        "depth": 16
    },
    {
      "type": "writers.ply",
      "filename": "phase1-phase2-mesh.ply",
      "faces": true
    }
]
}
…and view it in meshlab:
This shows us that yep, the phase 2 data are a lot denser! We could also use some slight adjustments – we could try to minimise the distance between phase 2 points and phase 1 points. Or, rasterise everything to 25m and forget about the details. But that is not the point! We have it all, let’s use it all.
Using the same strategy, we can also create the usual array of suspects – combined DSMs for plugging into your usual workflows, and clipped point clouds for undertaking tasks like alignment-before-analysis. We can also keep doing this here on our local machines; or shift the grunt to someone else’s computer and have the results delivered.
Summary and takeaways
As for part 1, this post continues the theme of ‘manage all the data, everywhere’ using a strategy which allows immersive visualisation and rigorous analysis. Here we see a hydrographic use case – and we could keep scaling this approach to the entire ocean; and all of the datasets which come together to create maps on that scale.
Even better, there’s no need to harmonise all the data – if we’re effectively collecting just the parts we need and using a recyclable pipeline strategy, we can reproducibly transform data to align it all. In other words, you can use the data storage and collection strategy that works for your primary used case – you don’t need to be all things to all people!
A short but important note:
MH370 data were collected in response to the disappearance of Malaysian Airlines flight MH370 over the Indian Ocean in 2014. Before you leave, take a moment to reflect that these data are the result of tragic circumstances. Those lives, however, have given a legacy – an incredible gift for understanding our planet and it’s systems – for which we are thankful.
What’s next…
The third instalment in this series is ‘things’ – focussing on smaller scale data from RPAS. And then we’ll look at some terrestrial scan data. After that, we’ll get deeper depending on time and funding:
- is entwine really lossless? can we demonstrate that?
- custom data schemas and metadata querying!
- what else can we do?
- how did I get all the data processed?
The sales pitch
Spatialised is a fully independent, full time consulting business. The tutorials, use cases and write-ups here are free for you to use, without ads or tracking.
If you find the content here useful to your business or research, you can support production of more words and open source geo-recipes via Paypal or Patreon; or hire me to do stuff. Enjoy!