
This article is superseded! There’s a better way to do this, shown here. Everything below is kept because in 2017, nobody had a way to do this yet. It was, for the time, audacious.
Last week Geoscience Australia released a vast bathymetric survey dataset from phase one of an intensive search for the missing aircraft, flight MH370. Read the full story here.
I’ve been ruminating on the idea of treating bathymetric datasets in the same way I handle LiDAR surveys – as massive point clouds. So this dataset presented an opportunity to try some things out.
I used the Python library Siphon to extract data from NCI’s THREDDS catalogue – ending up with roughly 100gb of ASCII files on my working machinery. It was easy to see what these files contained – but they’re no good for my use case as lines of text. I had in mind dumping them all into a postgres-pointcloud database – but then, I got excited by the idea of visualising it all.
So I did.
The first step was to clean up the data. I needed to convert very nice descriptive headers into something that described the data in a less verbose way.
sed -i took care of that task. It also handled removing leading 0’s from two number longitudes. I still had ASCII data, but now I can do something with it!
Enter the Point Data Abstraction Library (PDAL). My new ASCII headers describe PDAL dimensions. My cleaned numbers left no doubt about what an extra 0 means. With a quick pipeline I turned all my data into LAS files, reprojected from lat/long to metres in EPSG:3577 – GDA94 / Australian Albers. I used this because it was the only cartesian projection which could feasibly swallow the whole region without any weirdness (for example writing out things that are in UTM44 as if they were in UTM48).
But wait – what? Why LAS?
…because it can be read by PotreeConverter. You can likely see where I’m headed now. After some wrangling to get PotreeConverter working on CentOS, I burned a bunch of RAM and CPU time to generate octree indexes of all 4ish billion bathymetry points. With some scaling fun and experimenting with just how much data I could throw in at once, I eventually rendered out and glued together visualisation. A screenshot is below. The interactive visualisation is no longer live, I’m working on a new hosting site and a better version – and will update this post when done!
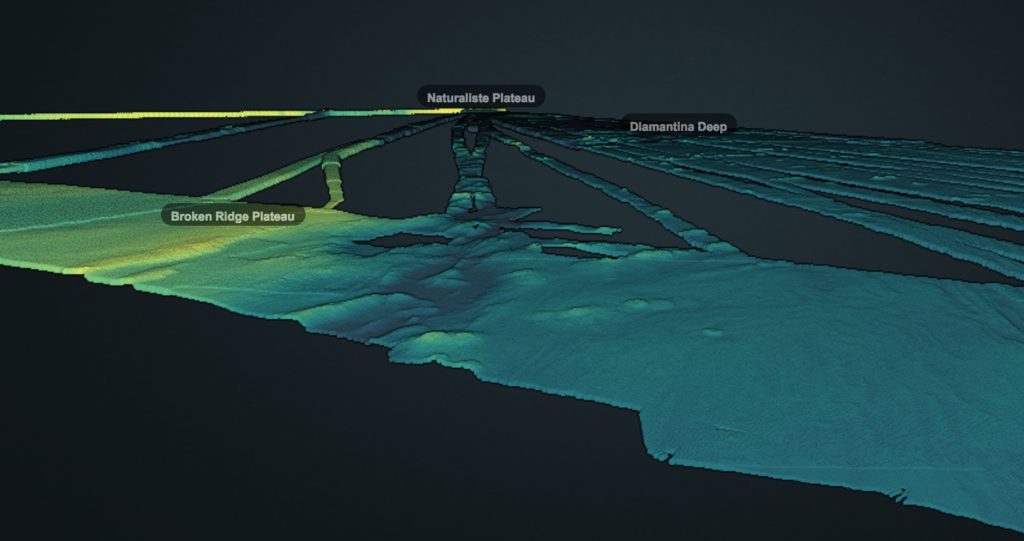
It’s not perfect by any stretch, but you can browse the entire dataset in 3D in your (Chrome or Firefox) web browser. It is a Potree 1.5 viewer, and doesn’t like Safari (yet). Given the number of individual indexes being loaded, it also sometimes overwhelms the capacity of a browser to open connection sockets. Ideally I’d have a nice basemap and some more context in there as well, but as a proof-of-concept it isn’t bad!
The whole thing is built with a mix of pretty simple freely available tools – from linux built-ins to cutting-edge webGL.
Why did I do all this, and could it be better?
I’m grateful to my employer for the time I get to spend on side projects like this, but there is a real purpose to it. When data get massive, it makes sense to shift big processing off of desktops and onto dedicated high performance compute hardware. Point cloud data are on the cusp of being workable – data as a service in the raster domain has been around for a while.
Point clouds have some special considerations, the primary one being lack of data topology. Creating visualisations like this demonstrates one way of organising data, and makes light of the traditionally difficult task of investigating entire surveys. It also makes us ask hard questions about how to store the data on disk, and how to generate products from the original datasets on demand – without storing derivatives.
For this project, it would have been great to skip the LAS creation part and render straight from an underlying binary data source to the octree used for visualisation. And then, run an on-demand product delivery (rasterisation/gridding, analytical products) from the same data store. In it’s current form this is not possible. As-is, the data are designed for users to make their own copies and then do stuff – which is limited by the size of local compute, or the size of your public cloud account budget.
What next?
Prepare for testing with a point cloud data delivery service I’m working on. Tune in to FOSS4G (August, Boston) to hear about that.
In the meantime, play with it yourself! You can obtain the data shown here for free – it is at: http://dapds00.nci.org.au/thredds/catalog/pw31/catalog.html. I used the data in ‘bathymetry processed -> clean point clouds’ (direct link). The data are also held on AWS (see the Geoscience Australia data description) if that’s easier for you. Tinker with it, have look at the viewer, see what you can come up with!
Oh, and let me know if you spot anything unusual. WebGL lets all kinds of things happen in the ocean deeps
Thanks to Geoscience Australia for releasing the dataset to the public! And thanks to the National Computational Infrastructure (NCI) for my time and the hardware used to develop this technology demonstration.
The MH370 dataset is hosted on NCI hardware. However – I used the same methods for data access anyone in the general public would (my download stats were a big blip for a while..)