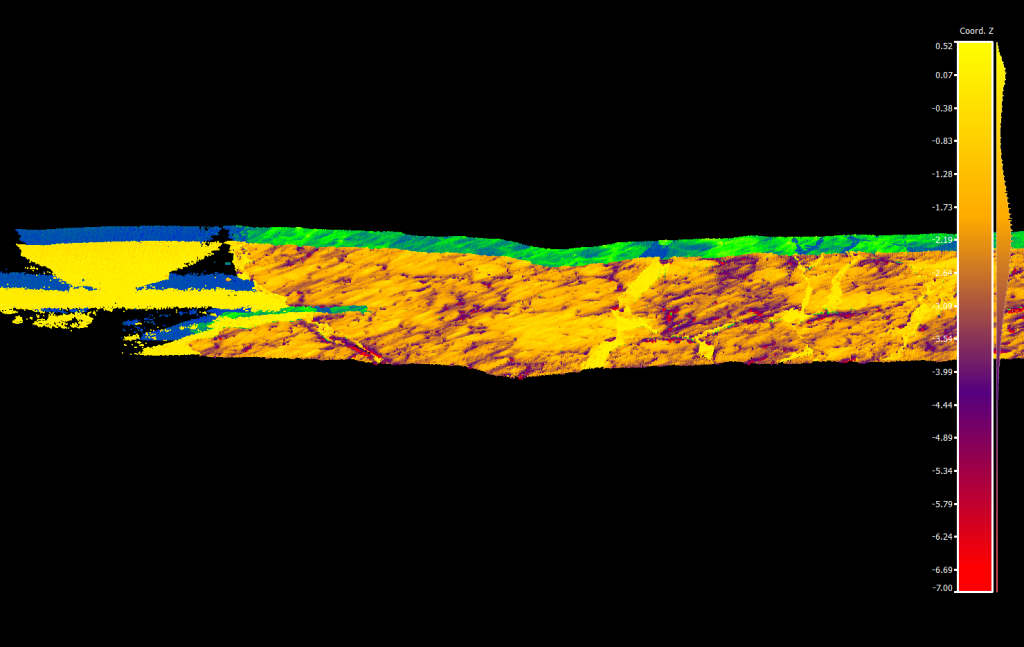
Between late June and late August 2015 I worked with the Antarctic Climate and Ecosystems Co-operative Research Centre (ACE CRC) to tidy up some long running loose ends with an airborne LiDAR project. This project is close to home – my PhD revolves around cracking some of the larger nuts associated with getting a science result from survey flights undertaken between 2007 and 2012. However, I’ve worked on one small subset of data – and the CRC was in need of a way to unlock and use the rest.
Many technical documents exist for the airborne LIDAR system, but the ‘glue’ to tie them together was lacking. In six weeks I provided exactly that. The project now has a strong set of documentation covering the evolution of the system, how navigate the myriad steps involved in turning raw logfiles from laser scanners, navigation instruments and GPS observations into meaningful data, and how to interpret the data that arise from the system. After providing a ‘priority list’ of flight data to work on, ACE CRC also took advantage of my experience to churn out post-processed GPS and combined GPS + inertial trajectories for those flights. The CRC also now has the tools to estimate point uncertainty and reprocess any flights from the ground up – should they wish to.
All of which means ACE CRC are in a position to make meaningful science from the current set of airborne LiDAR observations over East Antarctic sea ice.
Some of this – a part of my PhD work and a small part of the overall project – is shown here. A first-cut of sea ice thickness estimates using airborne LiDAR elevations, empirical models for snow depth, and a model for ice thickness based on the assumption that ice, snow and seawater all exist in hydrostatic equilibrium.
