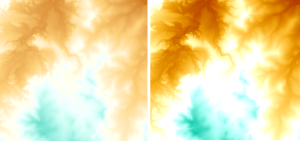
My first job as a new consultancy! In August 2013 I was asked to solve a DTM problem for a local airborne surveying company, Spatial Scientific.
Starting with two collections of ASCII points at different spatial resolution and an orthophoto, my job was to find out which DTM was ‘right’ – or free of unusual artifacts. Given the initial data format, my first instinct is to treat them as point clouds. In this case CloudCompare is the first port of call, and showed a clear pattern of artifacts present when the DTMs were compared. This exercise gave me a spatial context for the DTM issues – but when the gridded DTM points are 3 to 10m apart and the DTM differences are in the order of decimetres, it is very hard to tell where exactly the artifacts come from.
The solution came in the form of an image analysis approach. Initial concerns about the DTMs came from a raster DTM differencing process, so I first reproduced this result using the rasterised ASCII data. Again, this alone did not provide any clues about which DTM was at fault.
It was impossible to detect the DTM problems by close examination, and difficult to know which DTM was the issue by comparison. So I enlisted the help of image processing methods. Detecting edges and slopes in each DTM clearly identified the culprit – edges and steep slopes/steps leaping from the screen where none should exist! Combined with the CloudCompare result, it gave a very clear picture of where the DTM had problems and pointed clearly at the source. Problem solved.
Tools used: Cloudcompare; QGIS; Sextante; GDAL_translate; GMT